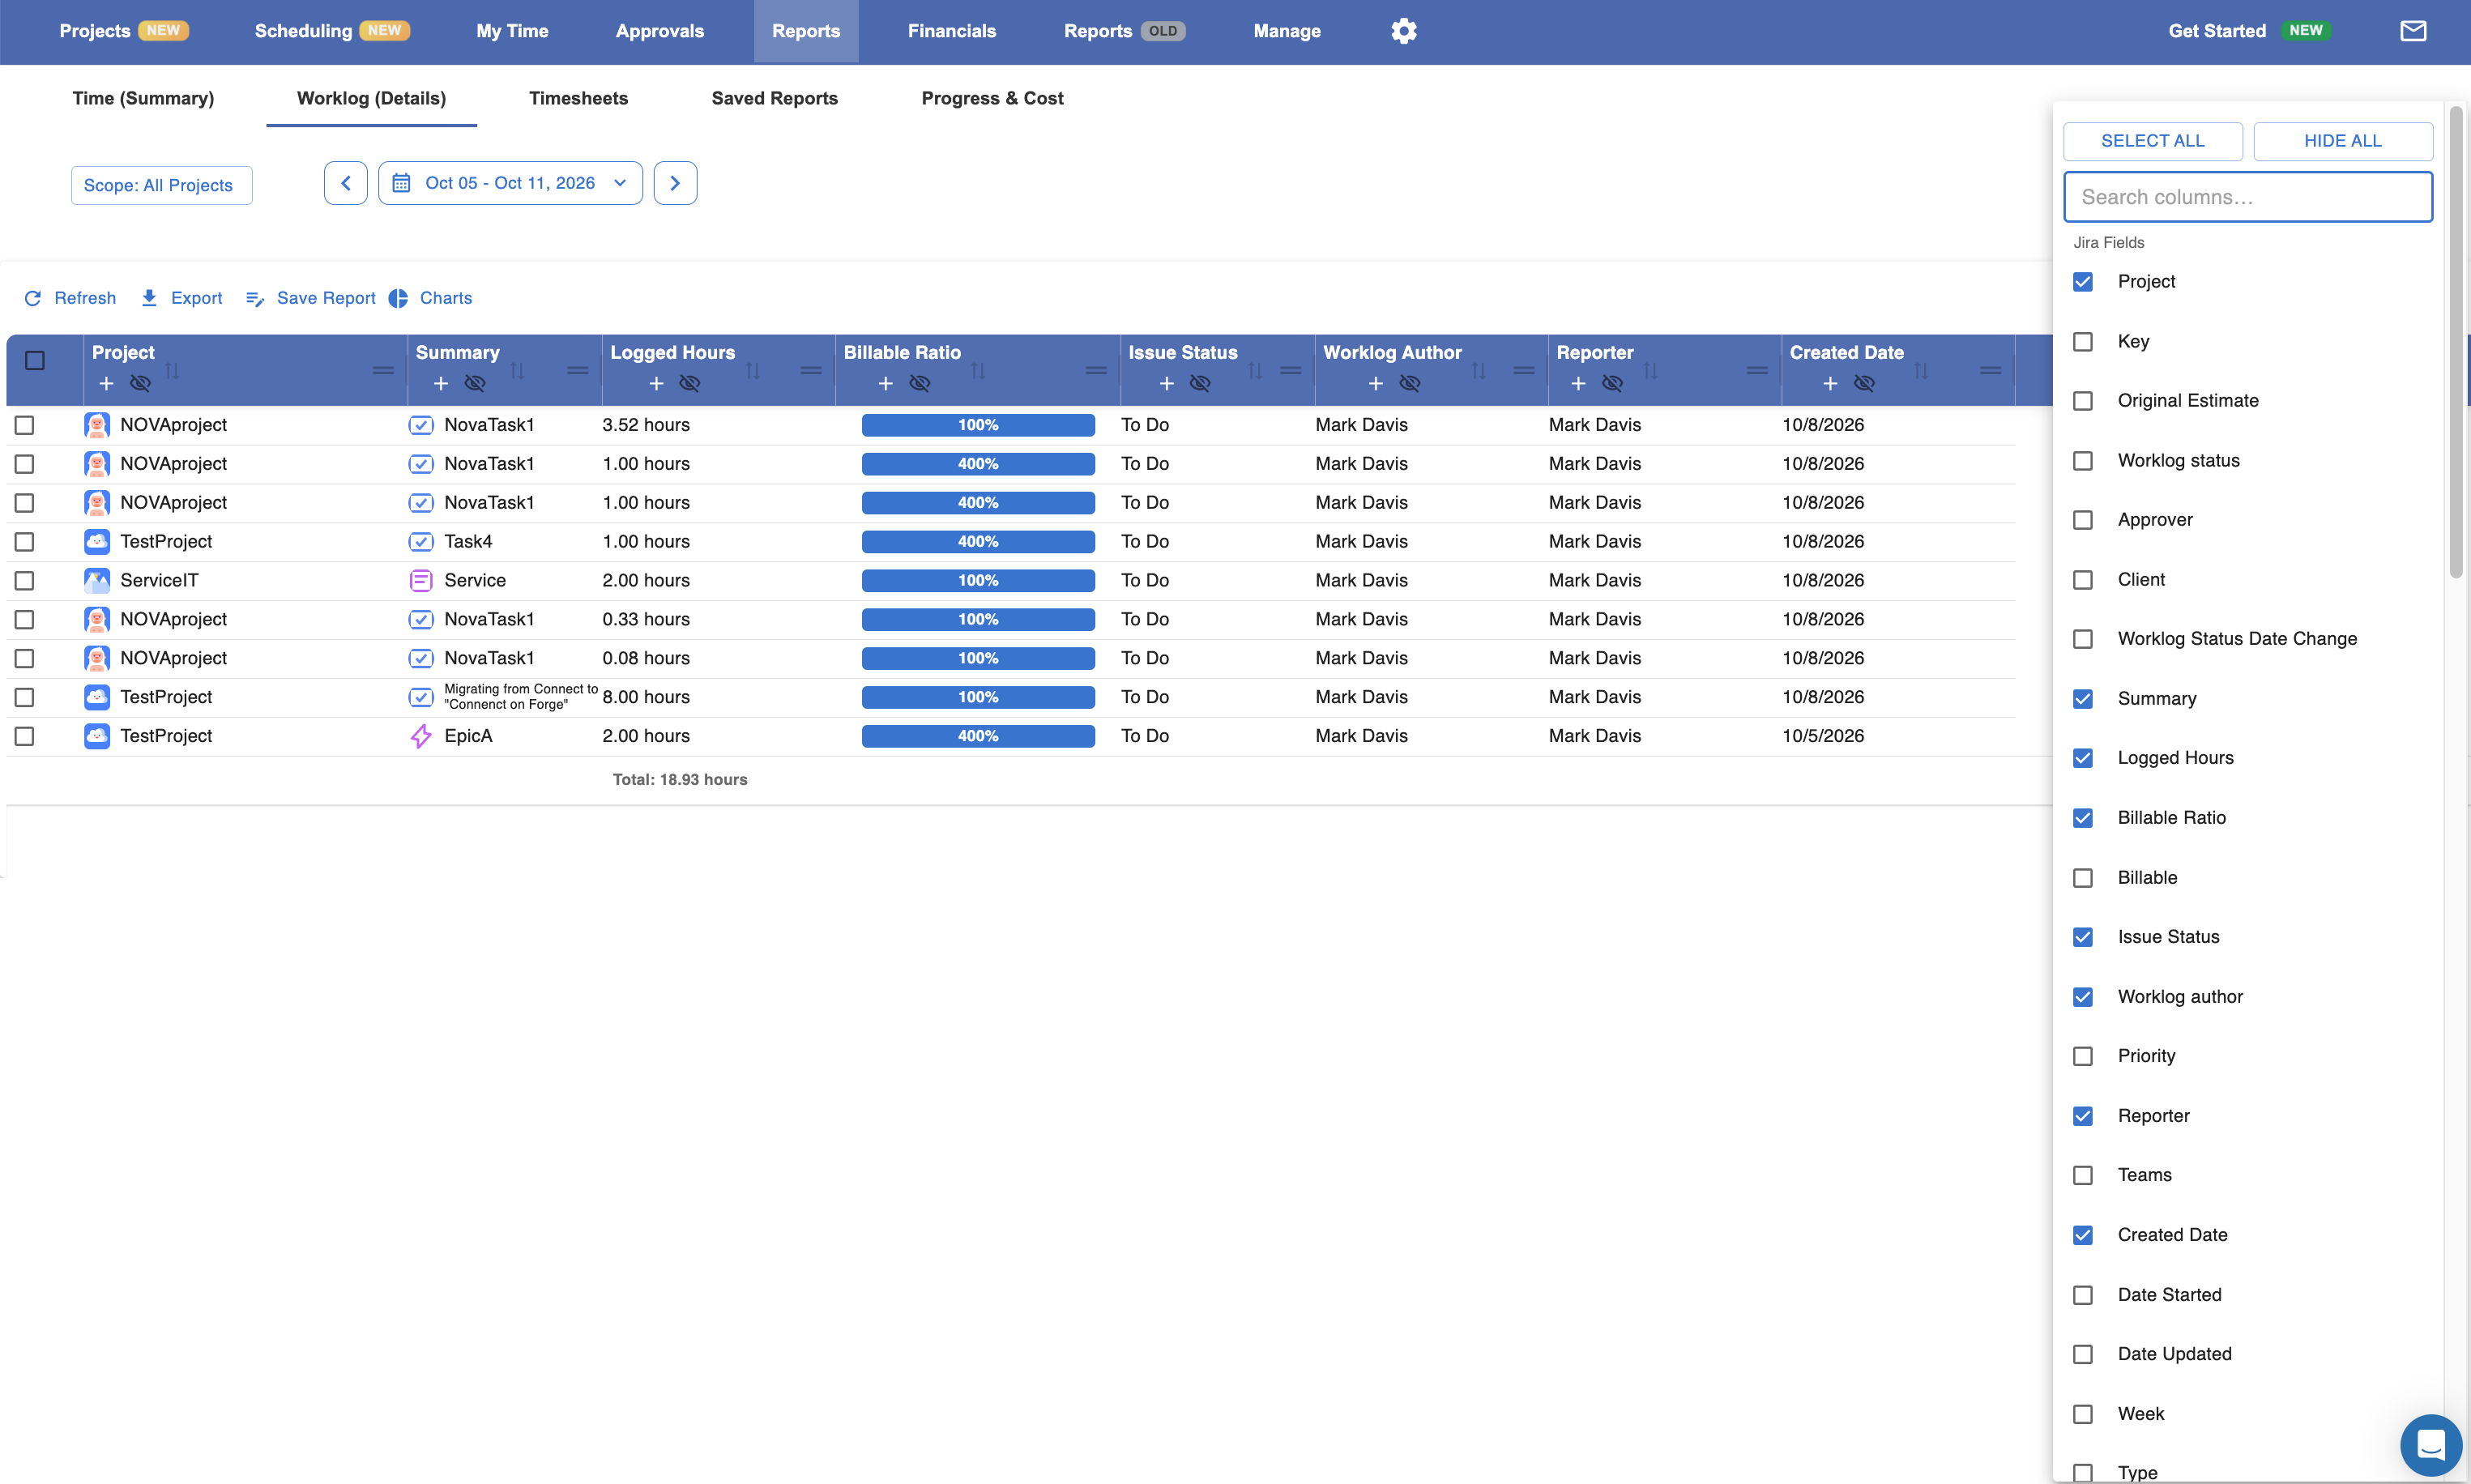
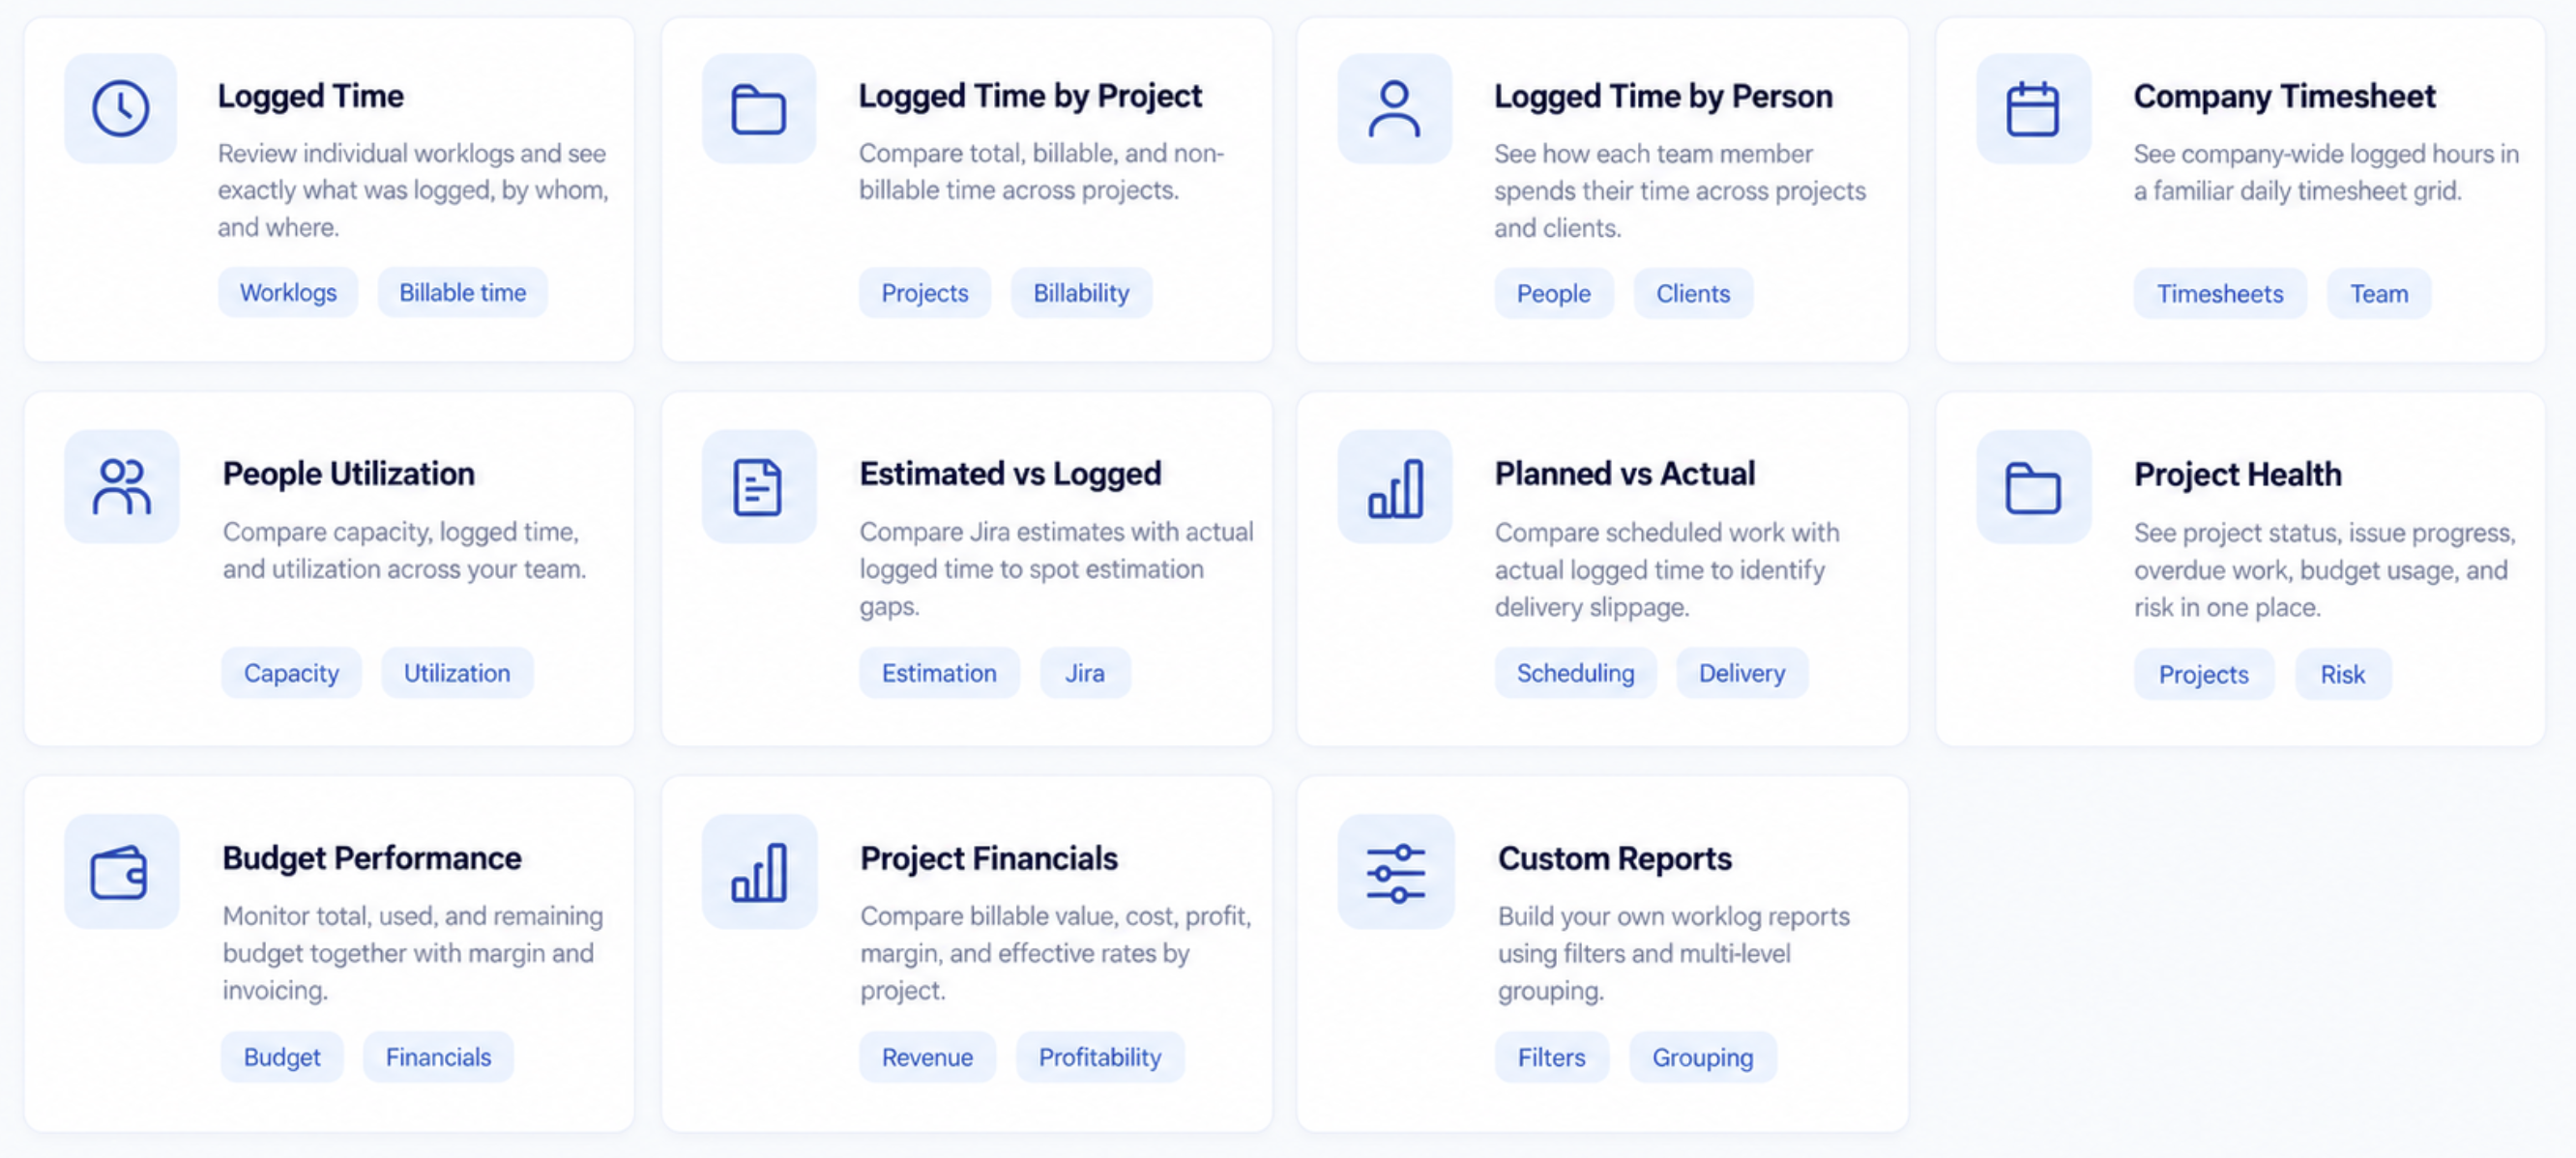
Worklog360 helps you analyze time, utilization, project delivery, budgets, costs, revenue, and profitability across your Jira projects and teams.
Use ready-made reports for common business questions, or create your own reports using filters and multi-level grouping.
Explore Reports
-
Time — review tracked time across your organization.
Includes:
Utilization — understand how available capacity is being used across your team.
Includes:
Delivery — compare estimates, planned work, actual time, and overall project progress.
Includes:
Budgets & Financials — monitor project budgets and understand financial performance.
Includes:
Custom Reports — build your own reports using filters and multi-level grouping.
Time Reports
Logged Time
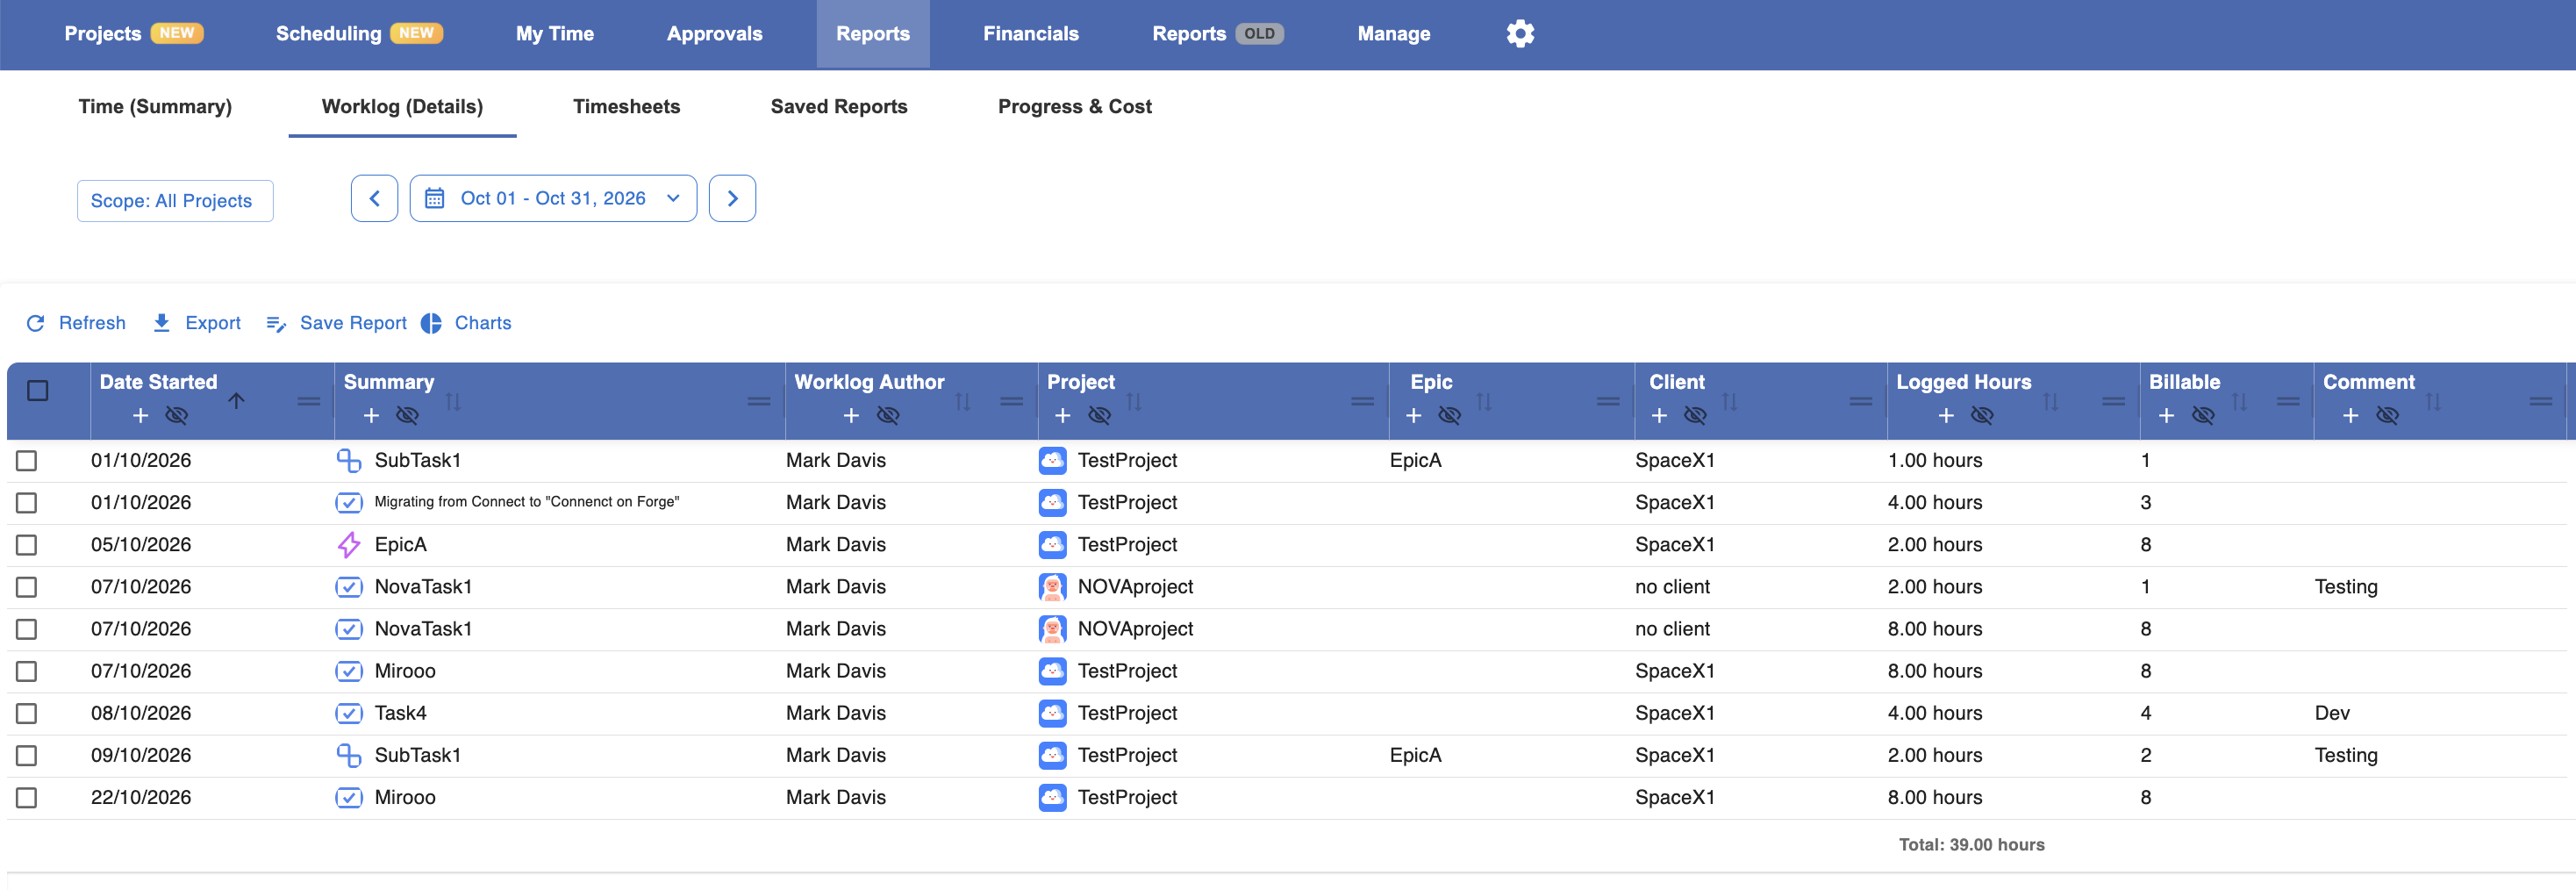
See tracked time across your organization and understand where effort is being spent.
Analyze time by:
-
-
Date
-
Person
-
Jira work item
-
Project
-
Client
-
Time spent
-
Billable time
-
Work description and many more Jira fields (including custom fields)
-
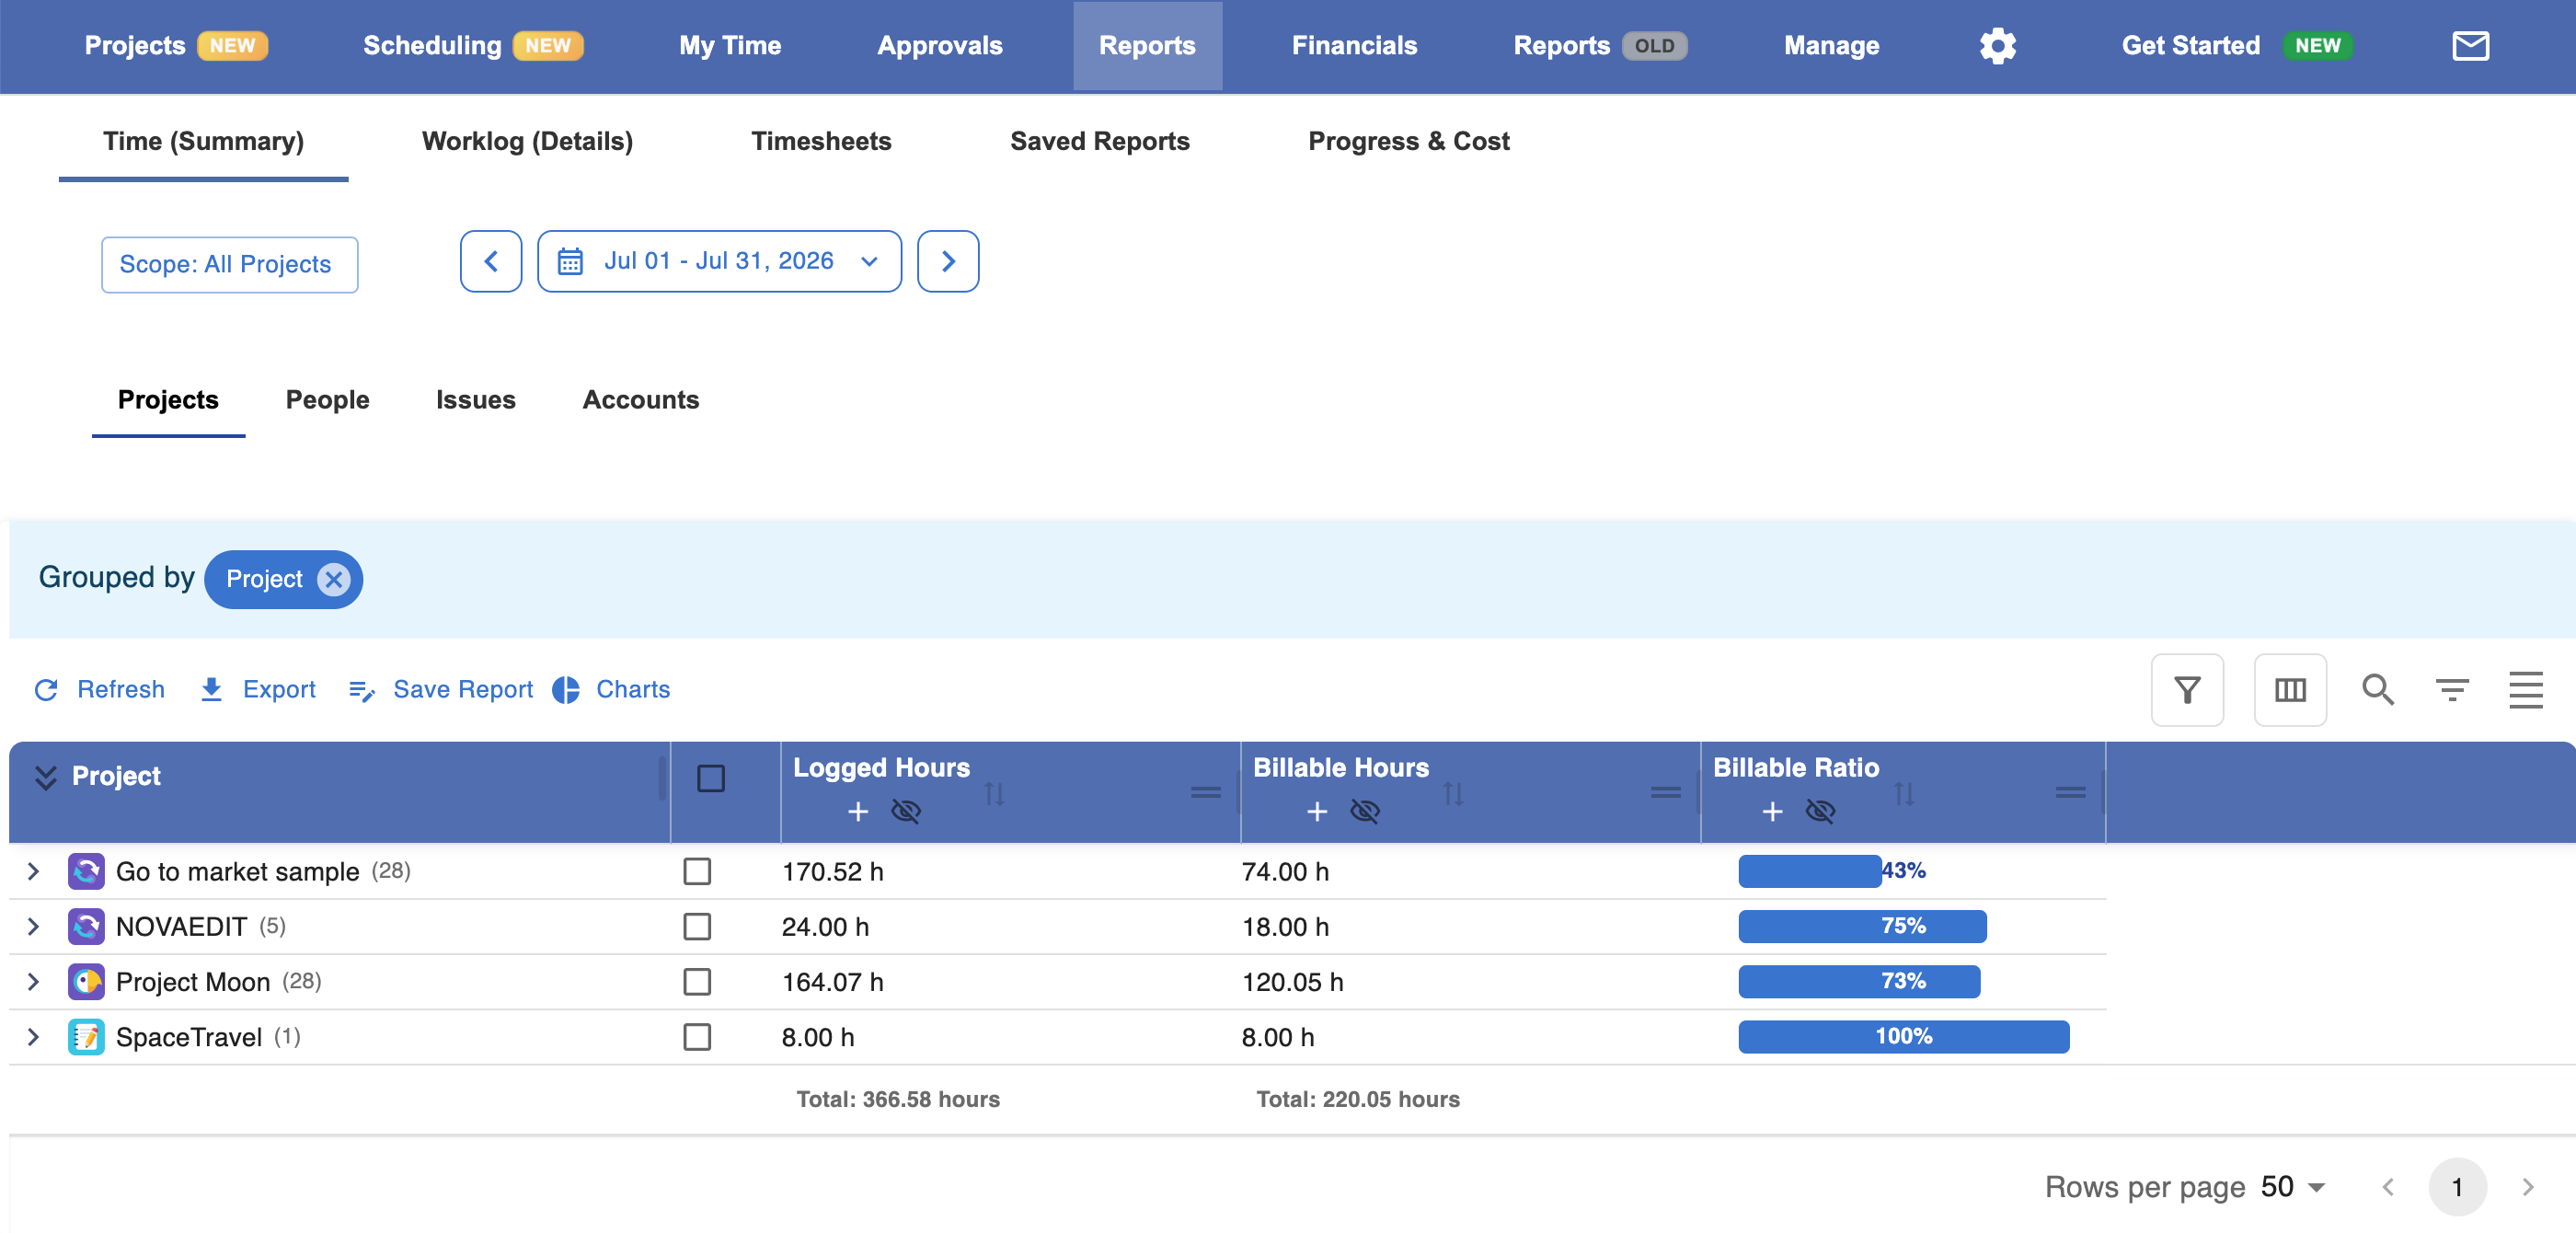
Logged Time by Project
Compare total, billable, and non-billable time across projects.
Useful for understanding which projects are consuming the most effort.
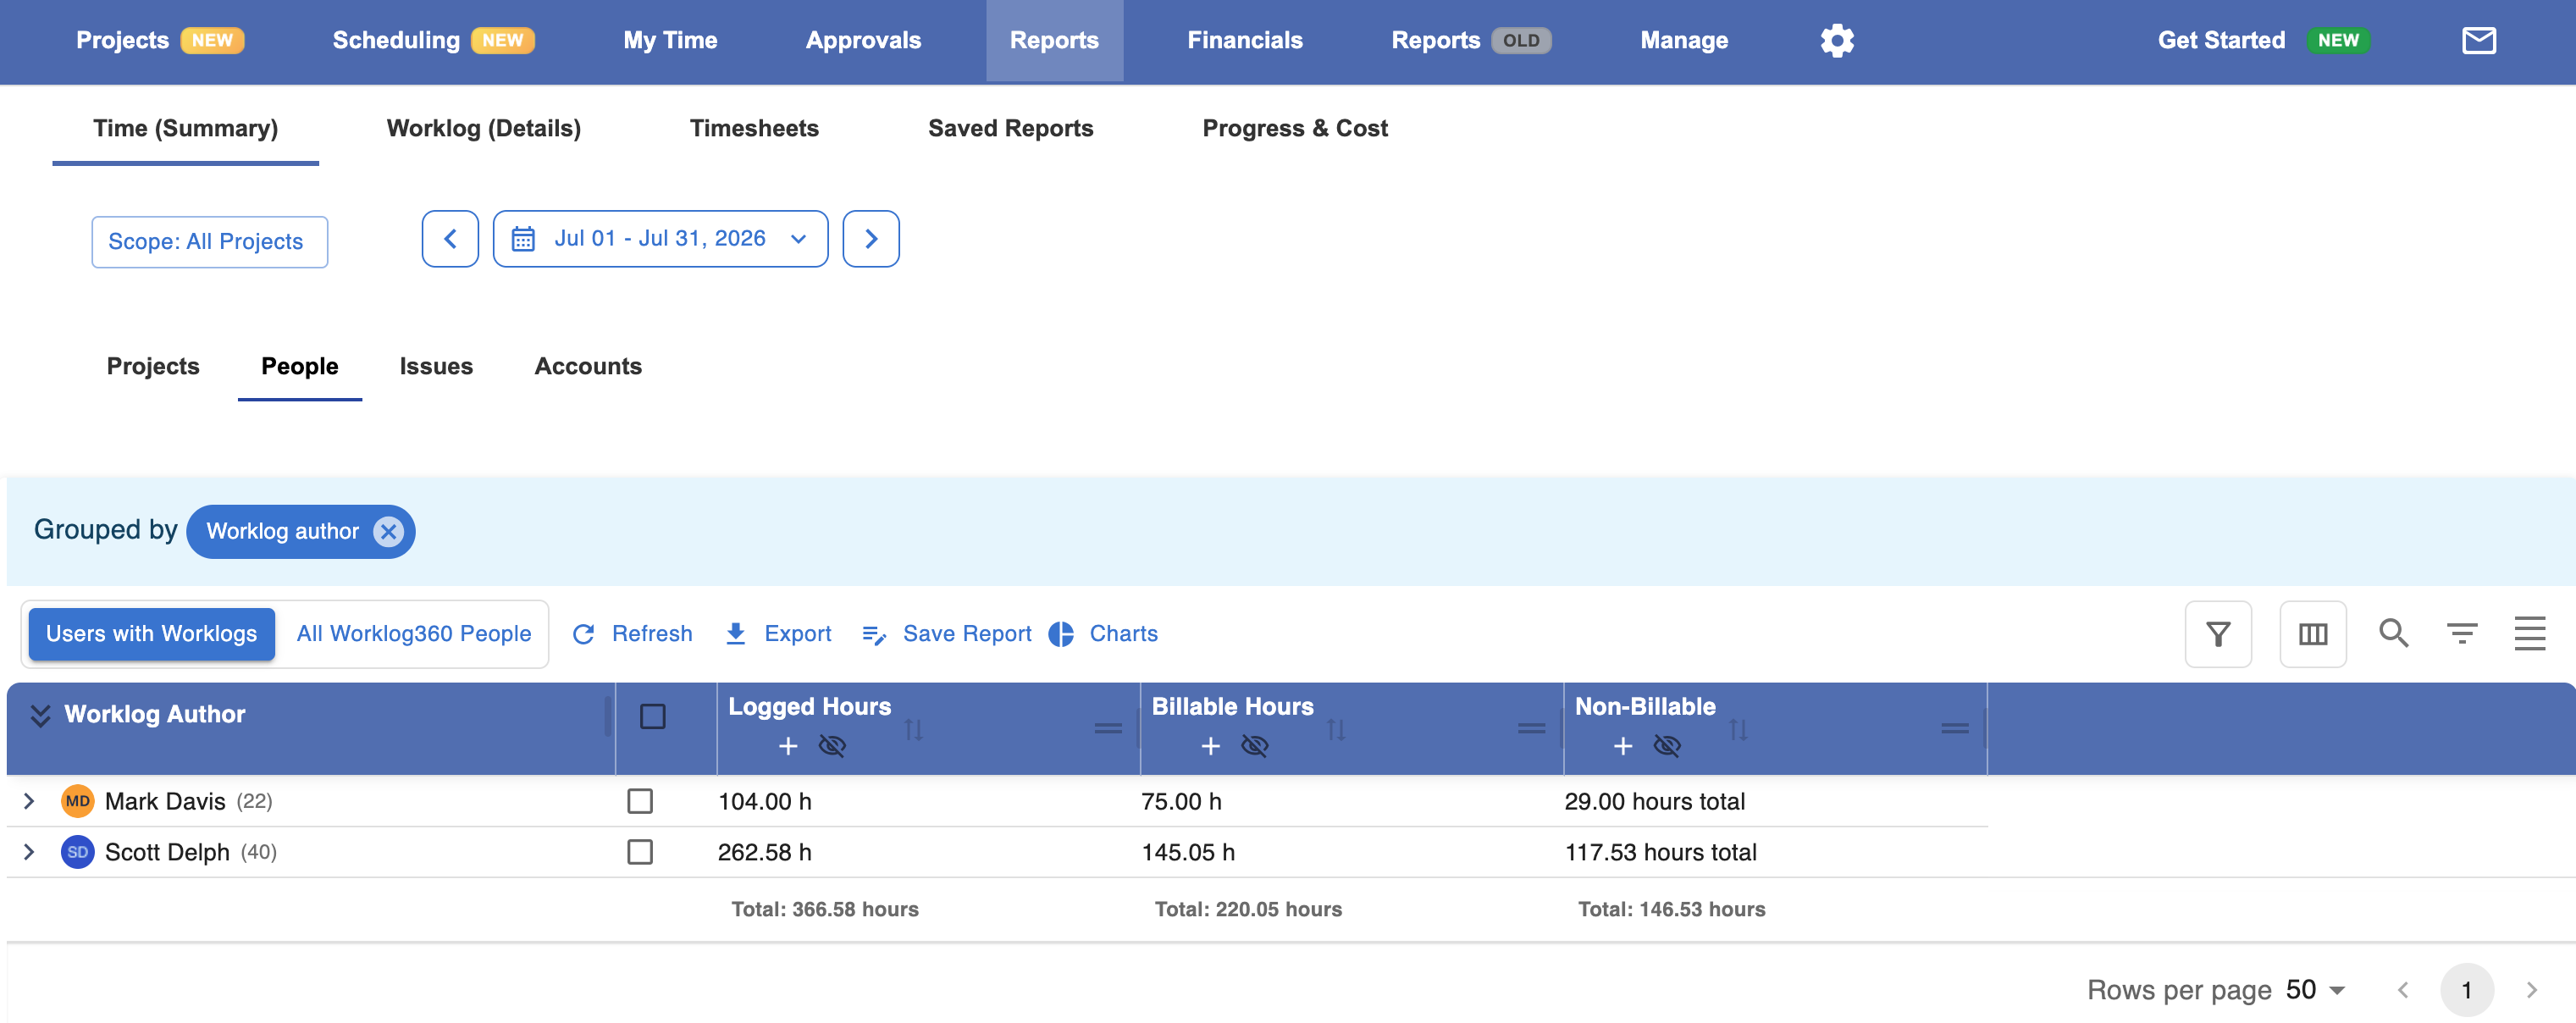
Logged Time by Person
See how each team member spends their time across projects and clients.
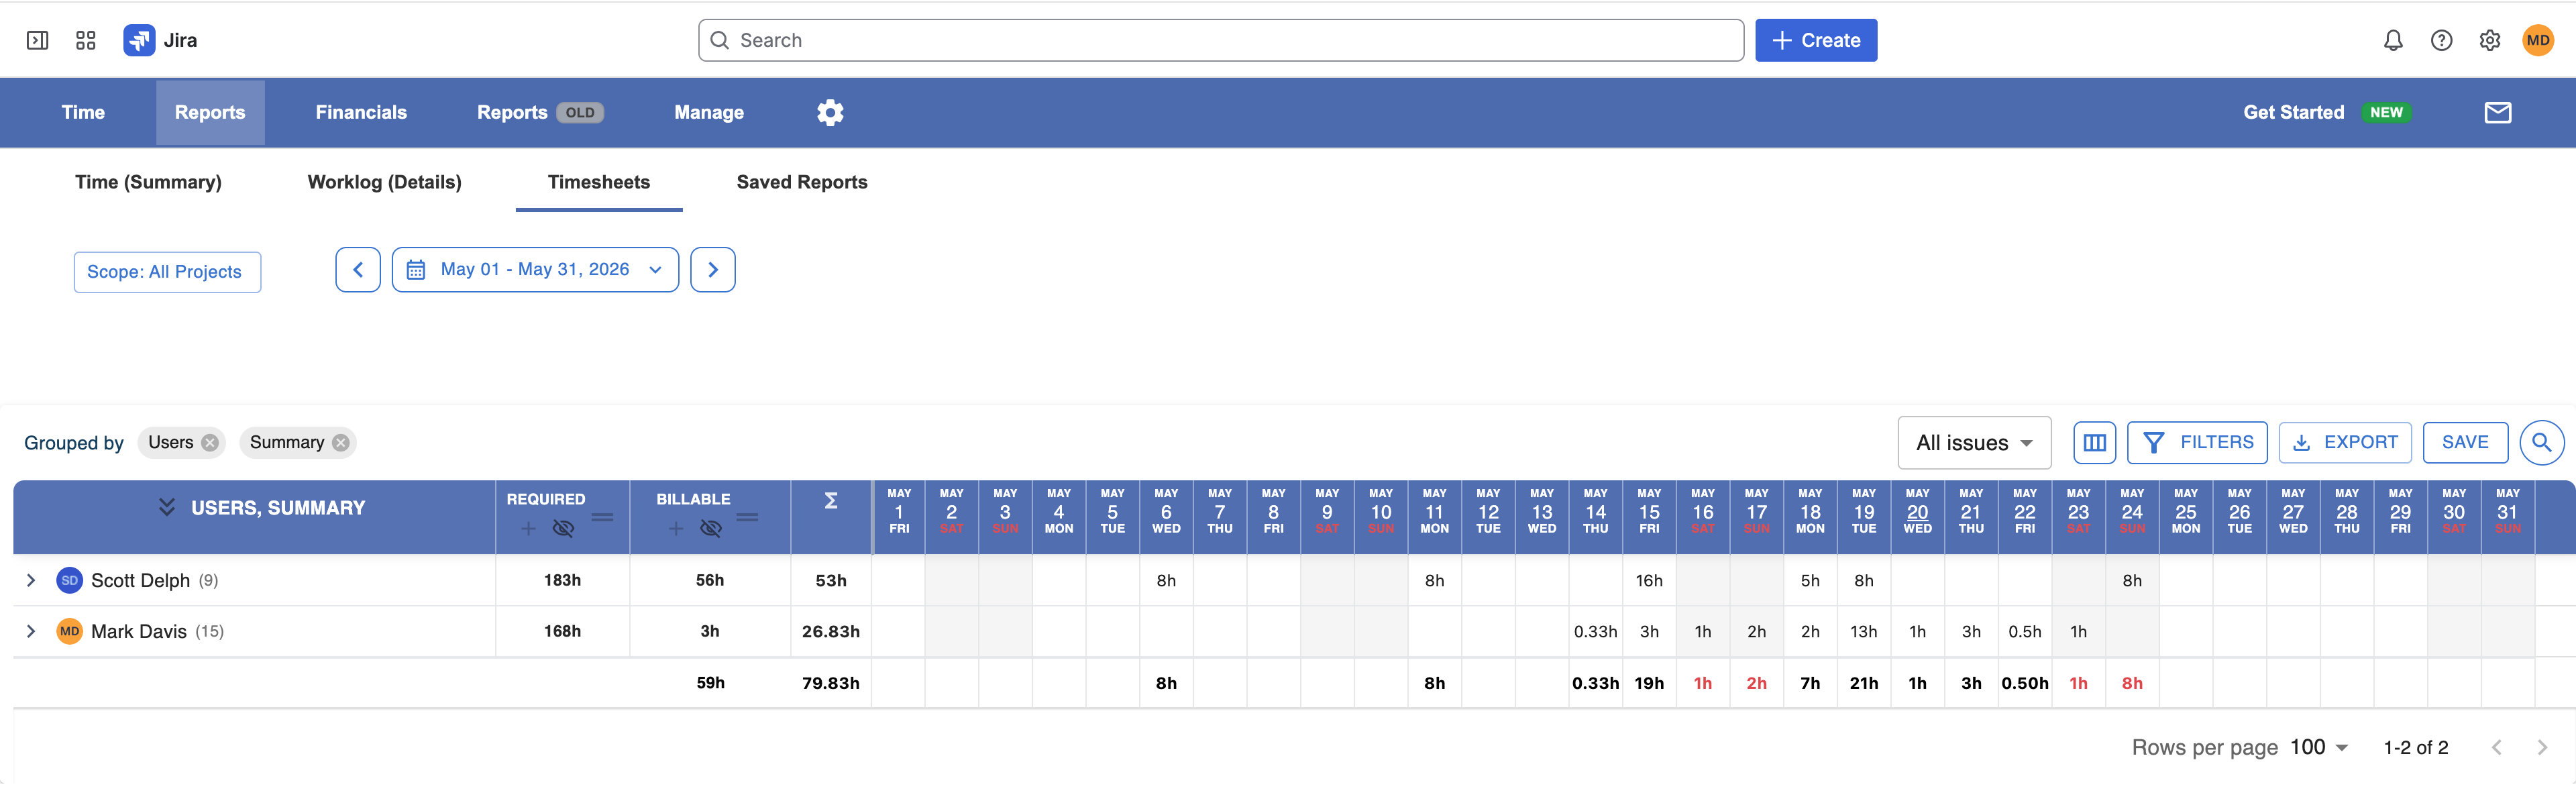
Company Timesheet
The Company Timesheet report gives managers a company-wide view of logged time across all users for a selected period.
Instead of reviewing individual worklogs one by one, the report presents time in a familiar timesheet grid, with users listed in rows and days shown in columns.
Use it to quickly understand:
-
Who has logged time
-
How many hours were logged each day
-
Whether users have completed their expected time
-
Where there are missing or incomplete entries
-
How total logged time compares across the team
The report can be viewed for a selected week, month, or custom period
Utilization
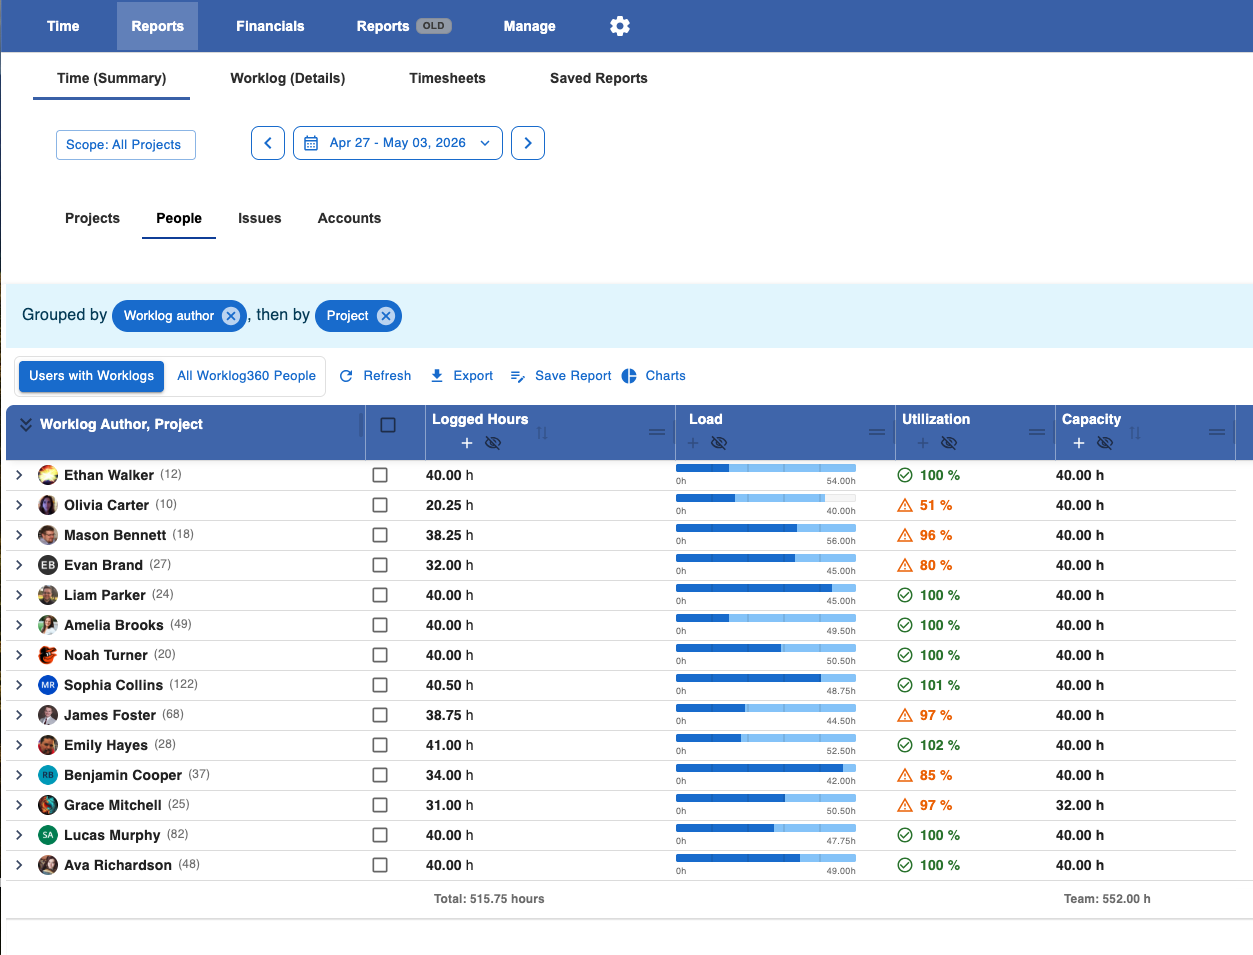
People Utilization
The People Utilization report shows how each person’s available capacity compares with the time they actually logged.
Use it to understand:
-
Who is fully utilized
-
Who has remaining capacity
-
Who is over capacity
-
How much work was logged during the selected period
-
How utilization compares across the team
Delivery
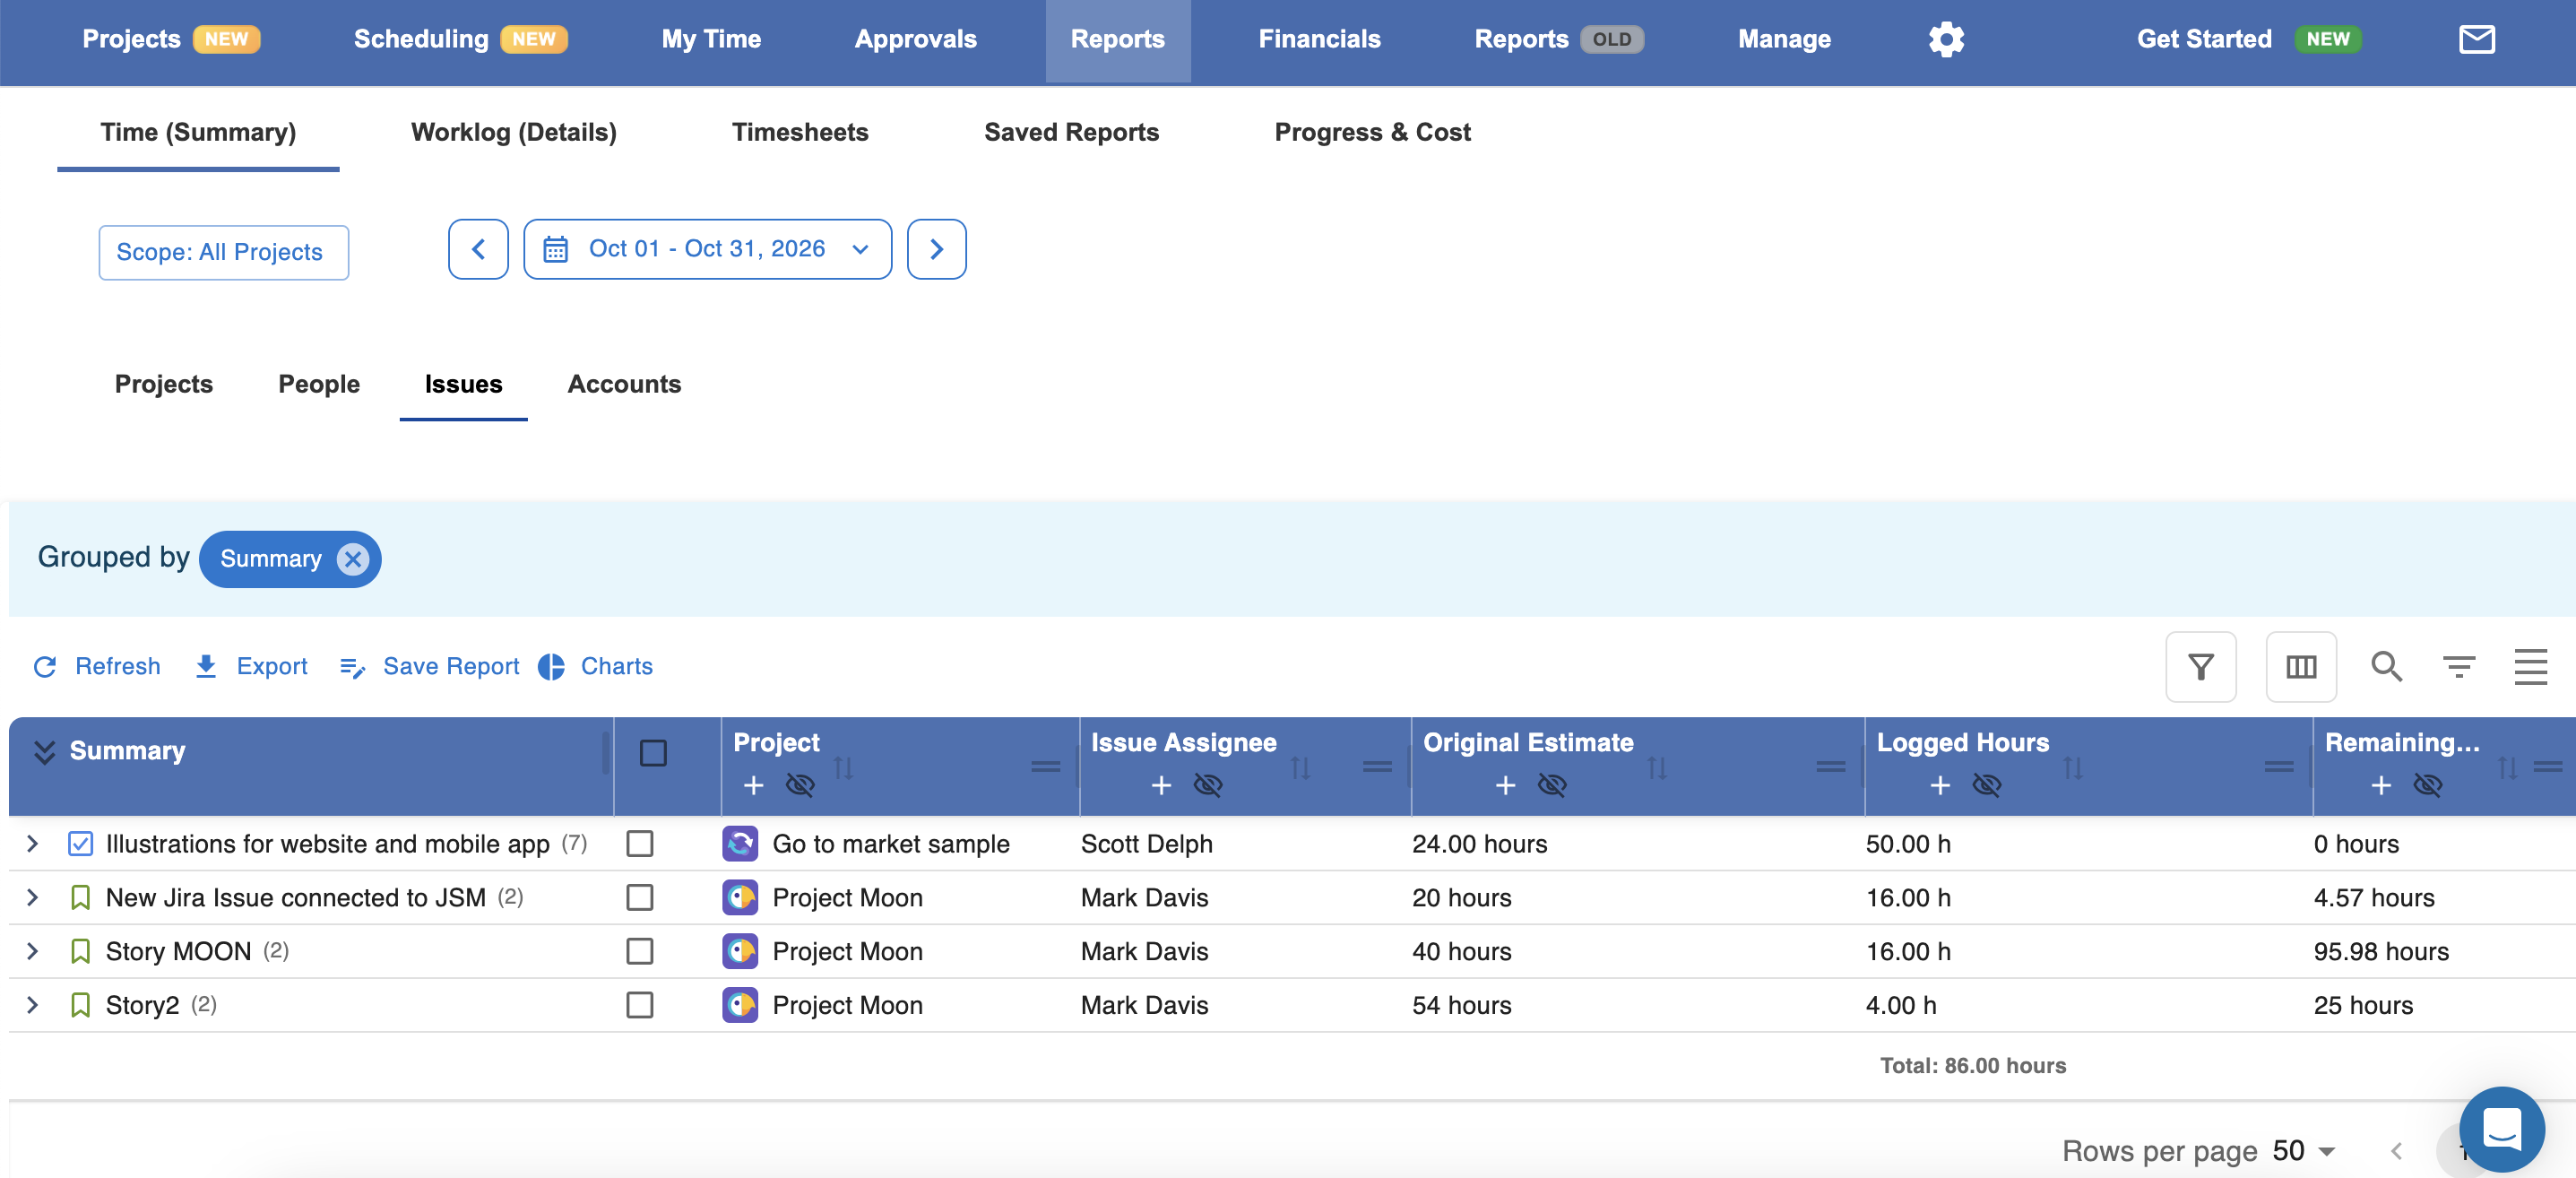
Estimated vs Logged
The Estimated vs Logged report compares Jira estimates with the time that was actually logged.
Use it to understand:
-
Which work items are taking longer than expected
-
Where estimates may be inaccurate
-
Which projects or services regularly exceed estimates
-
How much estimated work is still remaining
Planned vs Actual
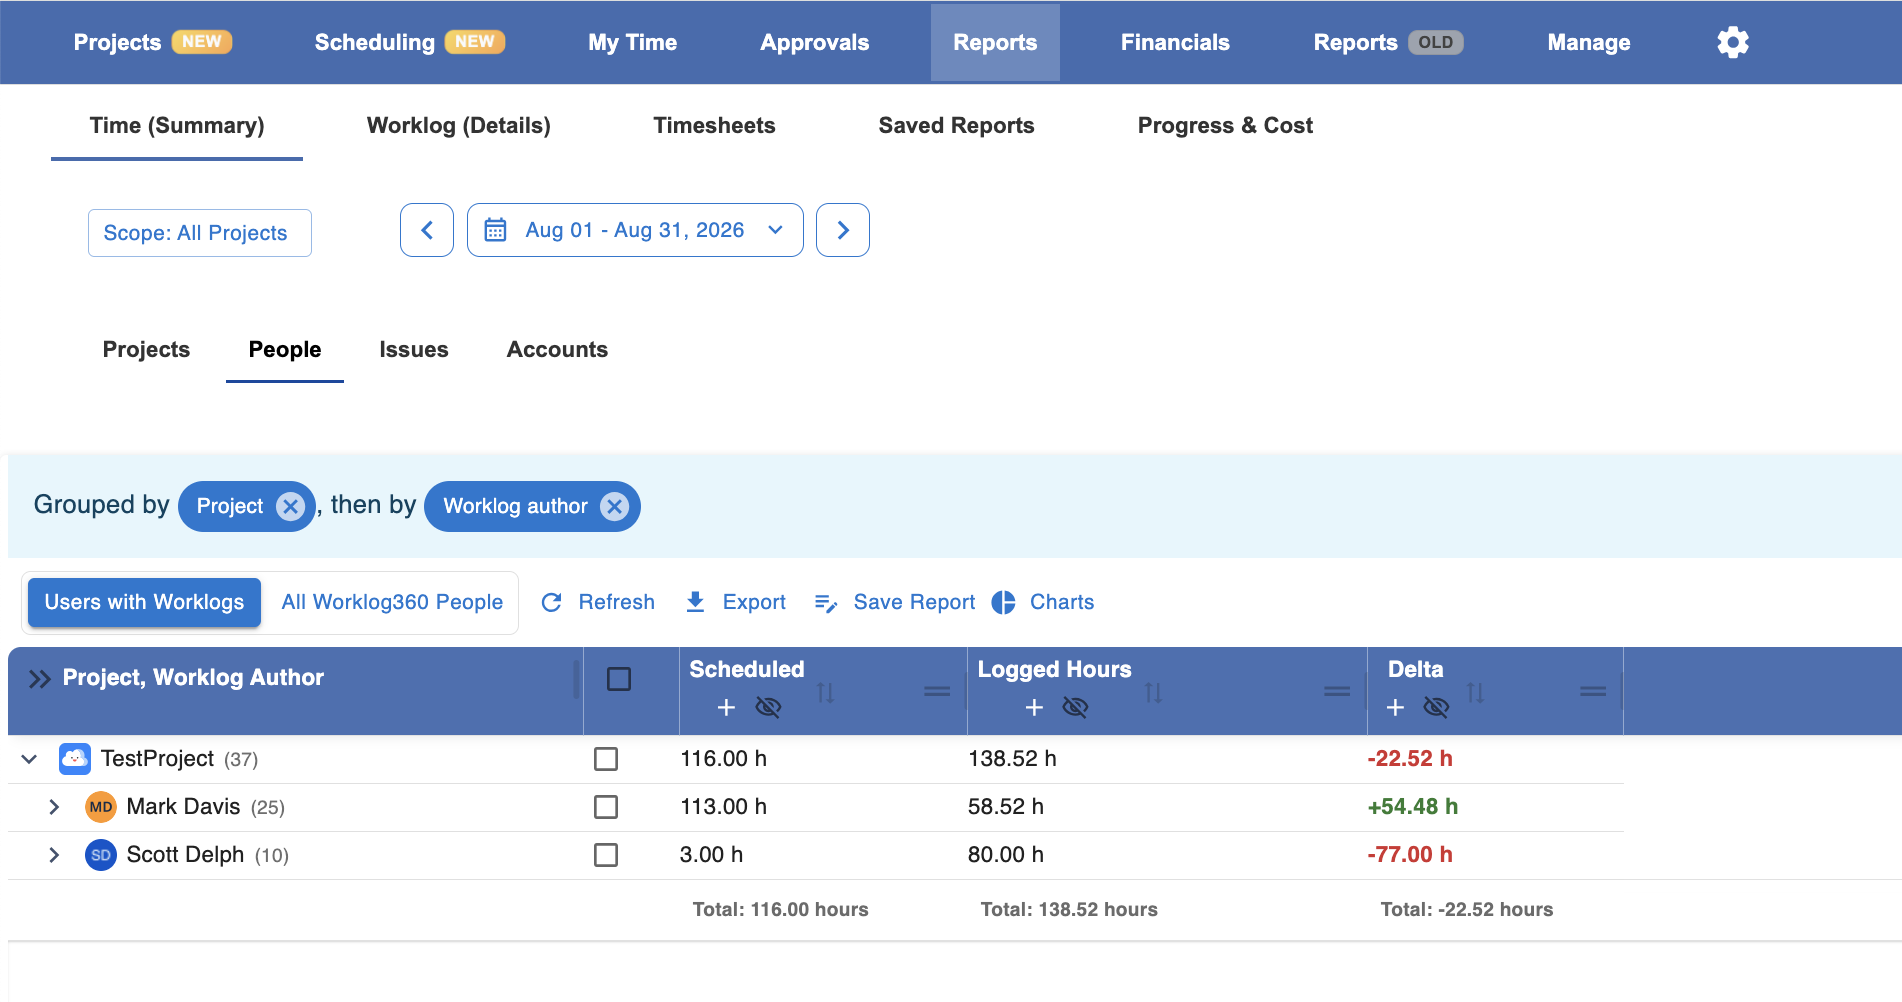
The Planned vs Actual report compares scheduled or planned work with the time that was actually logged.
Unlike Estimated vs Logged, which focuses on Jira estimates, this report focuses on resource planning and scheduled work.
Use it to identify:
-
Work taking more time than planned
-
Under- or over-allocation
-
Delivery slippage
-
Differences between planned capacity and actual effort
Project Health
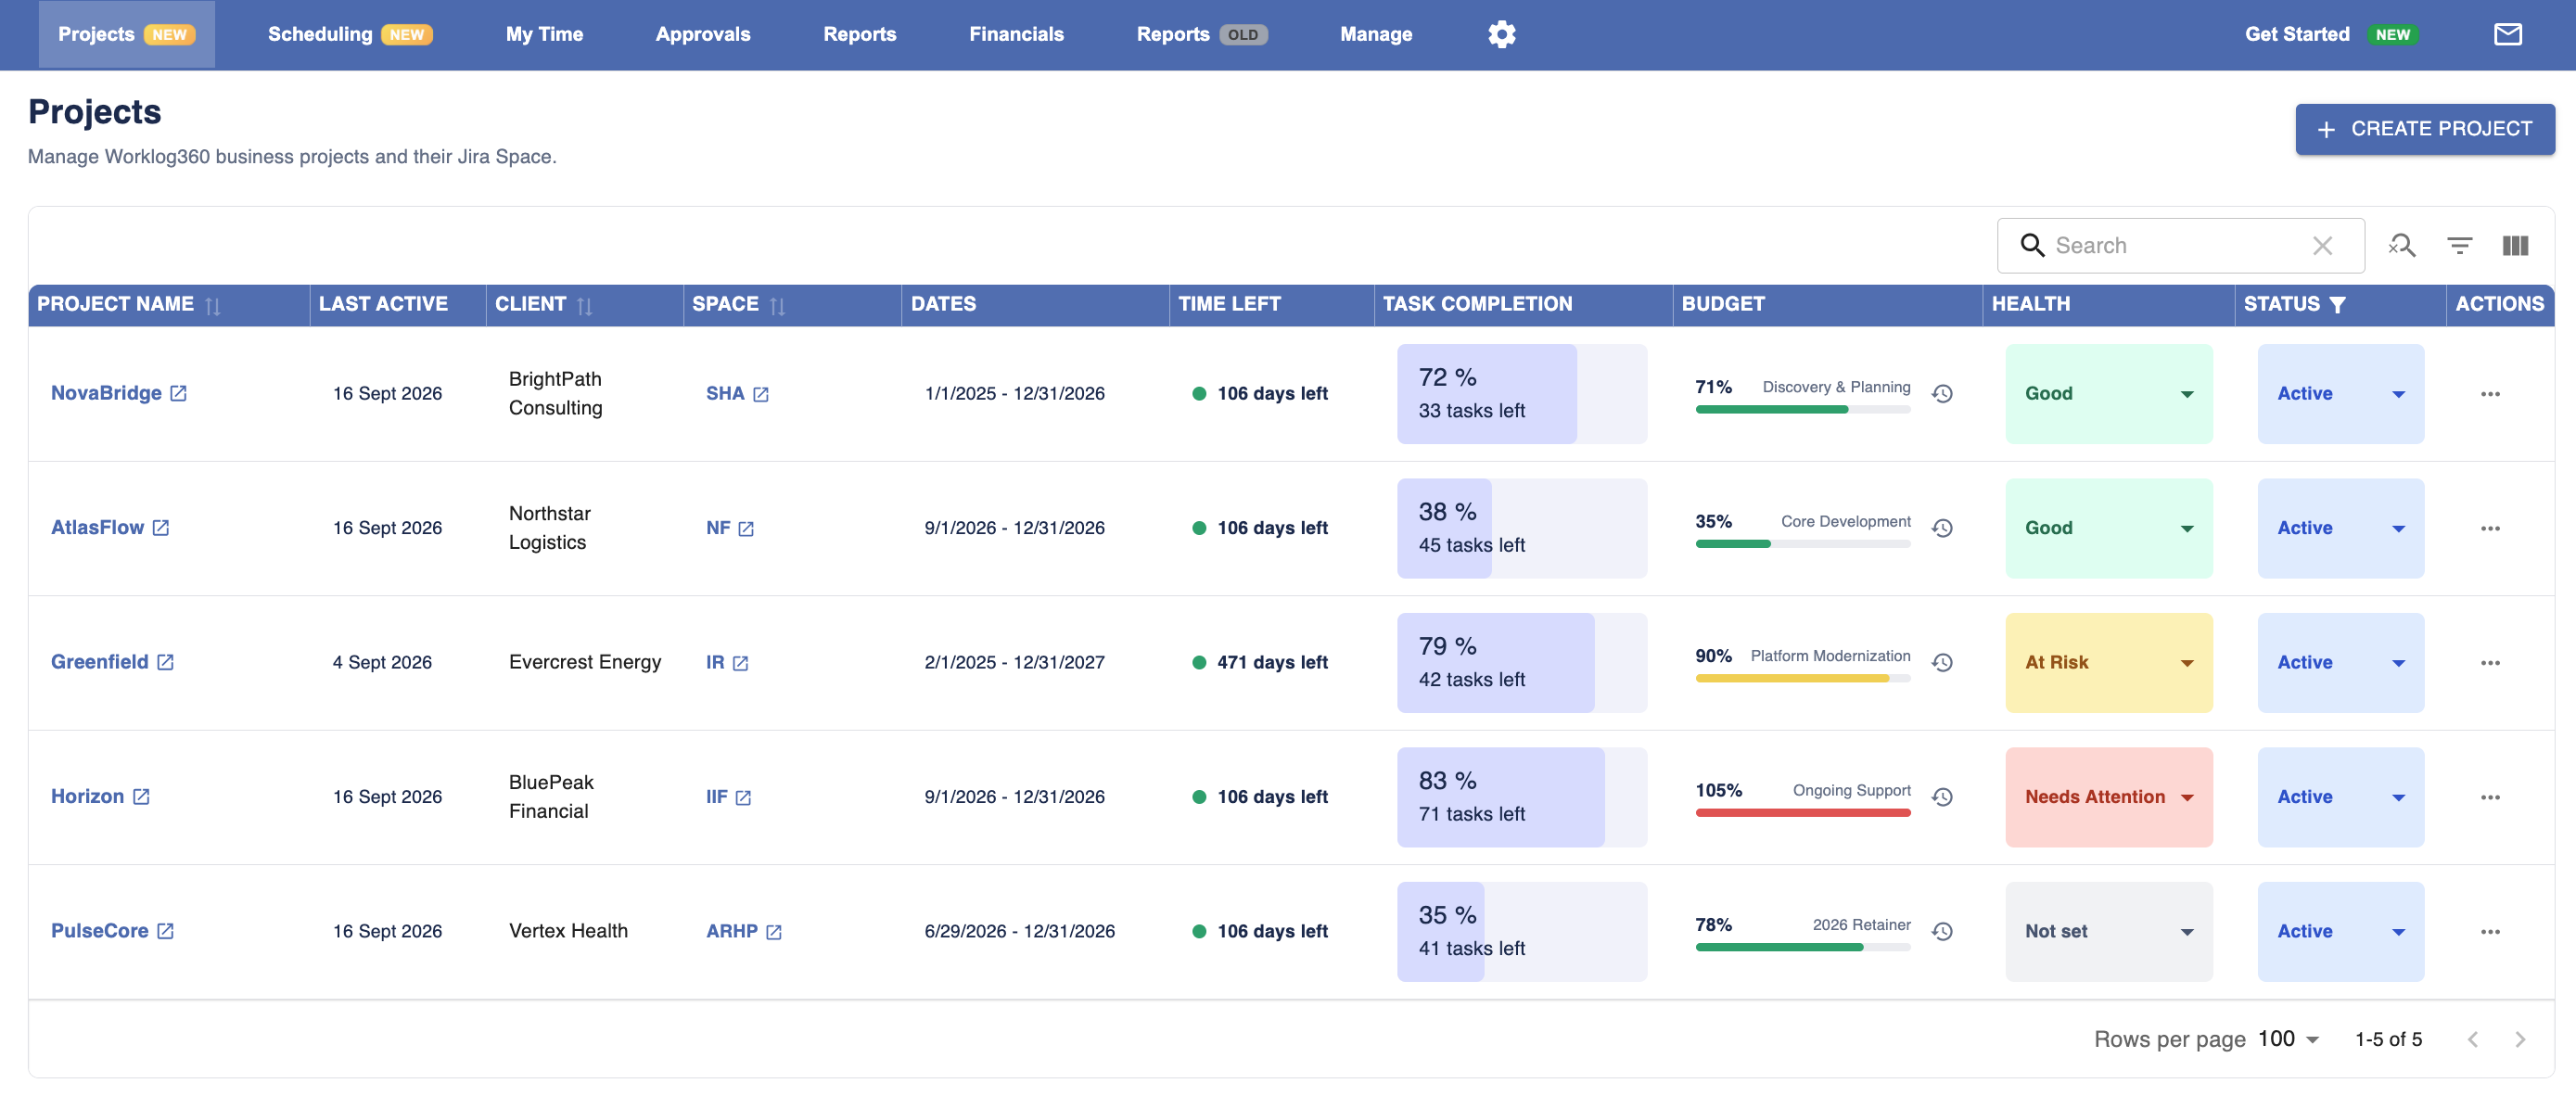
The Project Health report gives you a portfolio-level view of all projects and helps you quickly identify which ones need attention.
Budgets & Financials
Budget Performance
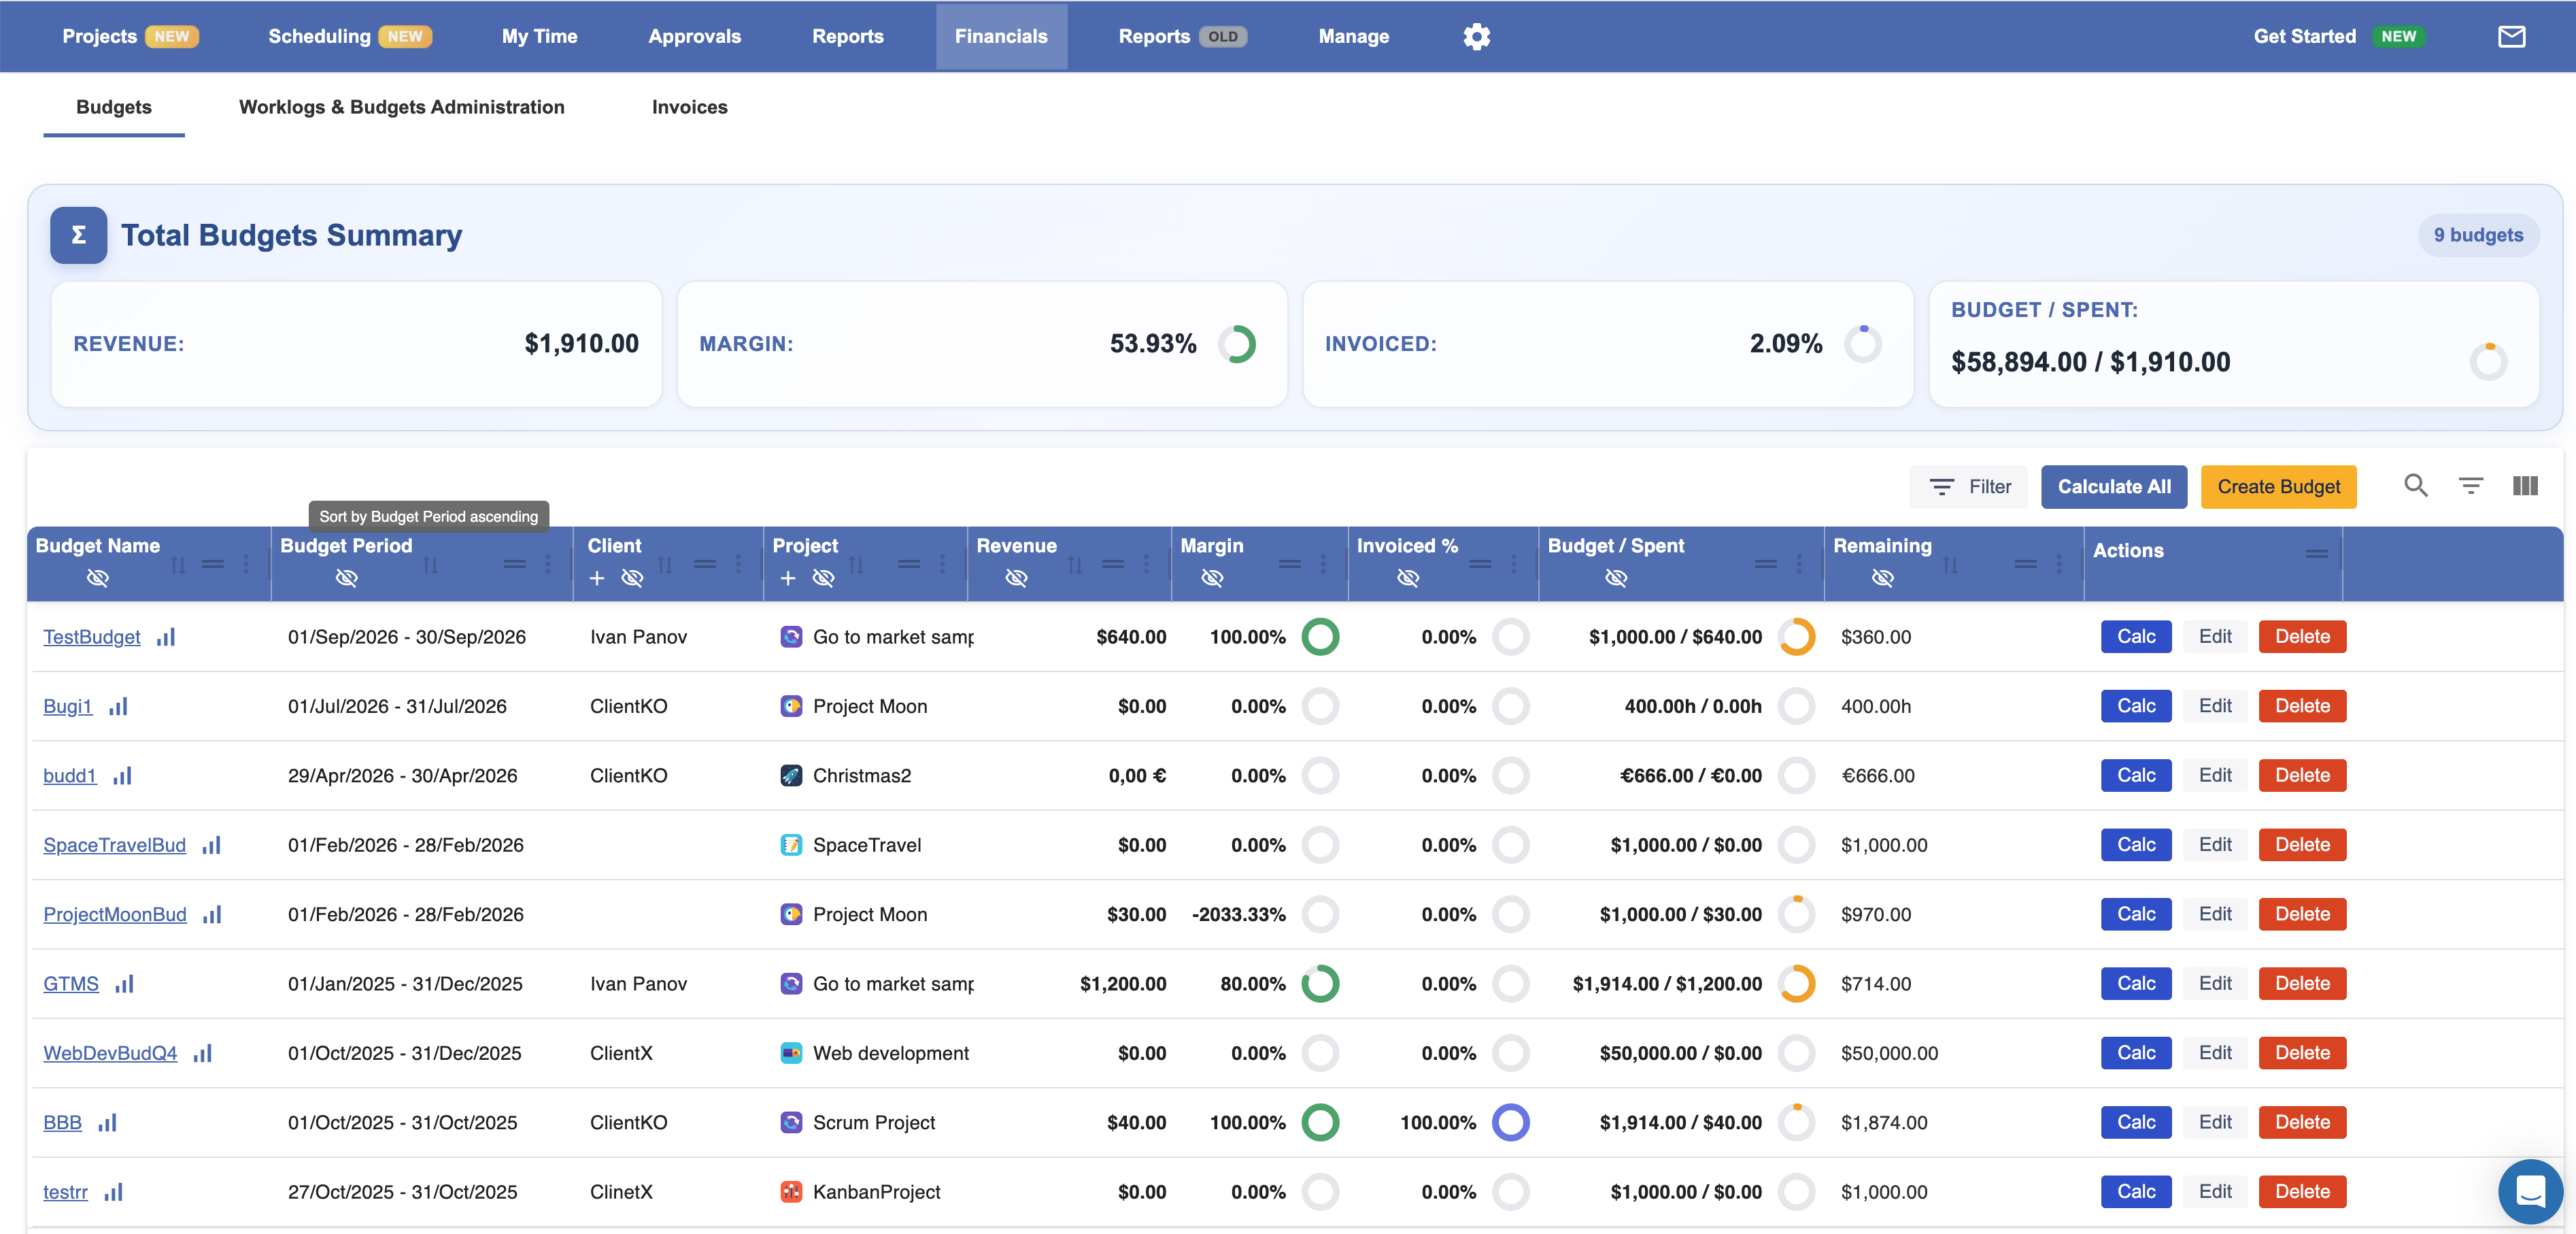
The Budget Performance report gives you a consolidated view of all project budgets and their current financial status.
Use it to quickly understand:
-
Which budgets are close to being consumed
-
How much budget remains
-
How much revenue has been generated
-
Current margin
-
How much has already been invoiced
-
Which client and project each budget belongs to
Project Financials
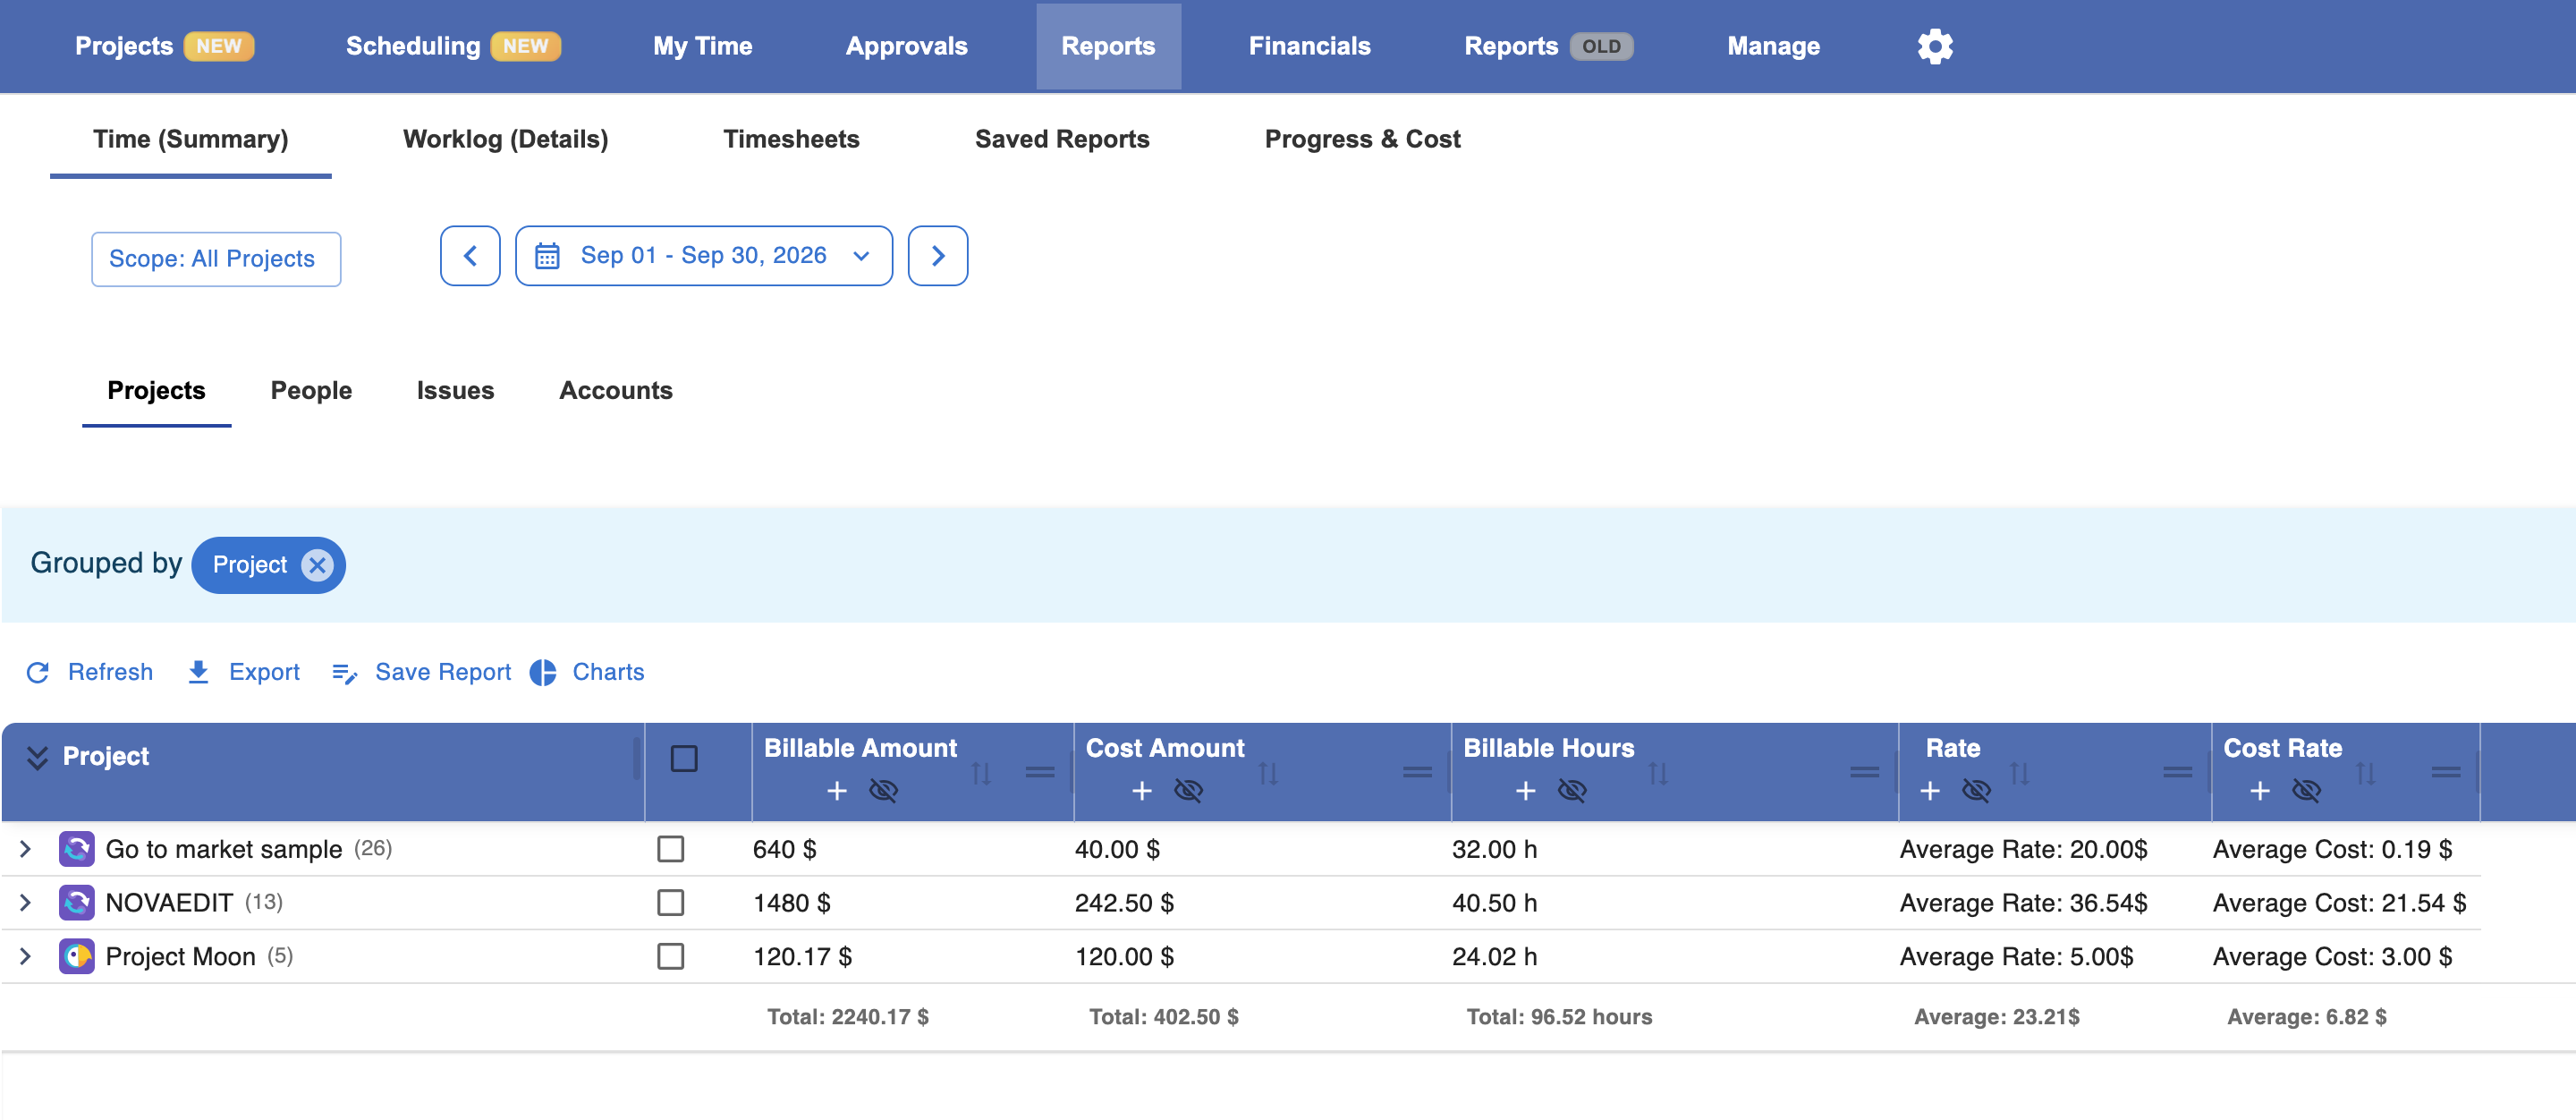
The Project Financials report brings the key financial measures for each project together in one view.
Use it to understand how much billable value a project generates, how much it costs to deliver, and the resulting profitability.
It helps answer:
-
How much revenue or billable value has the project generated?
-
How much did the project cost to deliver?
-
What is the resulting profit and margin?
-
How many billable hours contributed to the result?
-
What are the effective billable and cost rates?
Custom Reports
Worklog360 also allows you to create Custom Reports directly from worklog data.
Use Custom Reports when the predefined reports do not answer the exact question you have.
Filter the data
You can filter worklogs by fields such as:
-
Person
-
Team
-
Project
-
Client
-
Jira work item
-
Epic
-
Budget
-
Service
-
Billable / non-billable
-
Approval status
-
Date or reporting period
Multi-Level Grouping
Custom Reports support multi-level grouping, allowing you to start with a high-level view and drill down into increasingly detailed information.